Getting Started with jMeter
Introduction
This document explains how to create a minimal performance test plan with jMeter to run performance tests agains a Plone site.
Step 1: Install jMeter
The easiest way to install jMeter ist to install it from the package sources of your distribution (e.g. on Debian/Ubuntu):
$ sudo apt-get install jmeter
Note
Further install options http://jmeter.apache.org/usermanual/get-started.html
Step 2 : Create a Test Plan
Once you’ve started jMeter (e.g. by typing “jmeter” into the command line or by clicking on the jMeter icon on your desktop) you will see an empty Testplan:
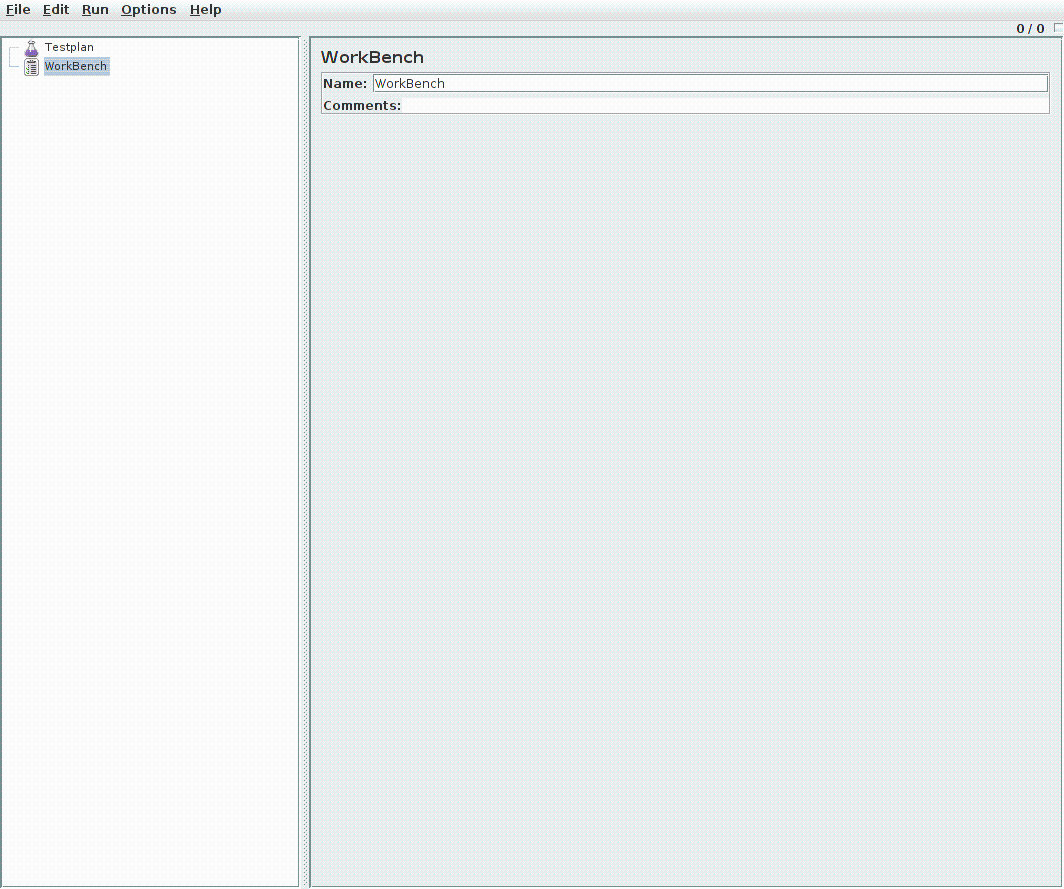
jMeter user interface with an emtpy test plan
A minimal jMeter testplan consists of the following elements:
Thread Group:
The root element of every test plan. It simulates the (concurrent) users than run all requests. Each thread simulates a single user.
HTTP Request Default (Configuration Element):
The default values for all HTTP requests within this thread group.
HTTP Request (Sampler):
An HTTP request that can be used to measure the time it takes to answer the request to a single URL.
Aggregate Graph (Listener):
An aggregate graph listener can be used to generate statistics about the HTTP requests that are used within a thread group.
Step 3: Create a Thread Group
In order to create a thread group, right-click on the Testplan in the left column of the jMeter GUI. Then choose “Add” and then “Threads (Users)” and “Thread-Group”. The titles might vary dependend on the jMeter version you are using:
Testplan > Add > Threads (Users) > Thread-Group
Fill out the right column with the following values:
Name: Users
Number of Threads (users): 2
Ramp-Up Period (in seconds): 1
Loop Count: 10
“Number of Threads (users)” is the number of concurrent users that jMeter will create to run the HTTP requests. The “Ramp-Up Period (in seconds)” are the seconds that jMeter waits between running the threads. The “Loop Count” describes how many times jMeter will run the tests.
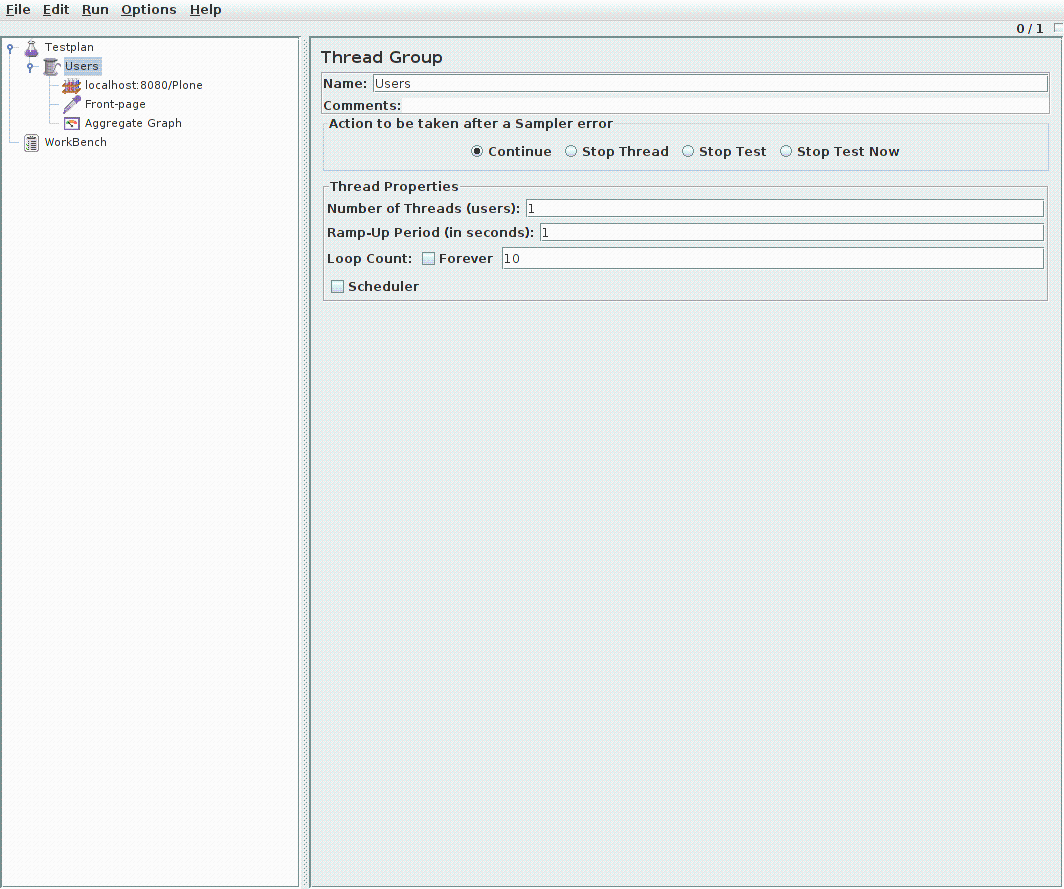
Thread Group
Step 4: Create HTTP Request Defaults
In order to run performance tests on certain resources, jMeter fires up HTTP requests. jMeter allows to create default values for all HTTP requests within a test plan, so that we do not have to add those values for every single HTTP request in our plan.
To add a “HTTP Request Defaults” element, right-click on the “Testplan” in the left column of the jMeter GUI, choose “Users”, “Add”, “Config Element” and “HTTP Request Defaults”:
Testplan > Users > Add > Config Element > HTTP Request Defaults
We set the default HTTP request values to use a standard Plone site that needs to be available under “http://localhost:8080/Plone”:
Name: localhost:8080/Plone
Server Name or IP: localhost
Port Number: 8080
Path /Plone
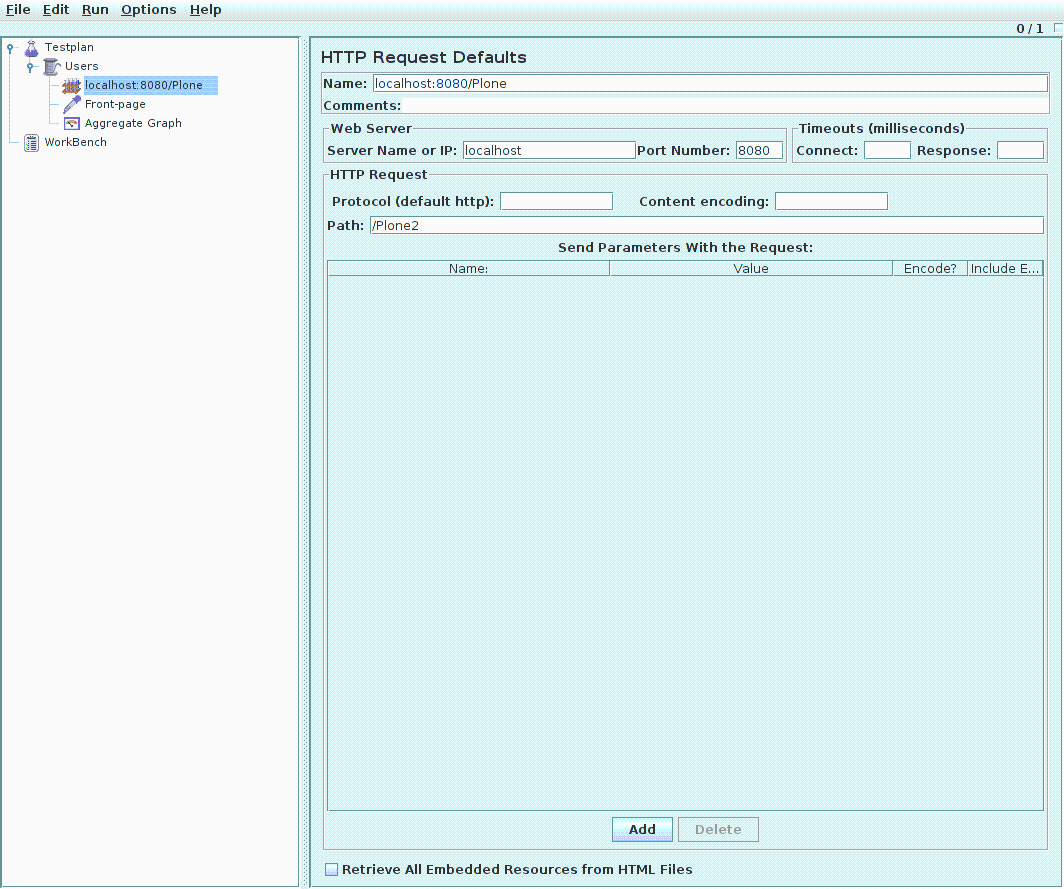
HTTP Request Defaults
Step 5: Create an HTTP Request
In order to run a performance test on the front page of our Plone site, we create a “HTTP Request” element, by right-click on the “Testplan” in the left column of the jMeter GUI, choose “Users”, “Add”, “Sampler” and “HTTP Request”:
Testplan > Users > Add > Sampler > HTTP Request
We give the HTTP request a name and provide a path. We don’t have to fill out the server name or port number, since our “HTTP Request Defaults” element takes care of that:
Name: Front-page
Path: /Plone/front-page
Note
The values are just defaults, not prefixes. This means if you want to add an HTTP request for “front-page” it is not enough to use “/front-page”, you always have to provide the full path “/Plone/front-page”.
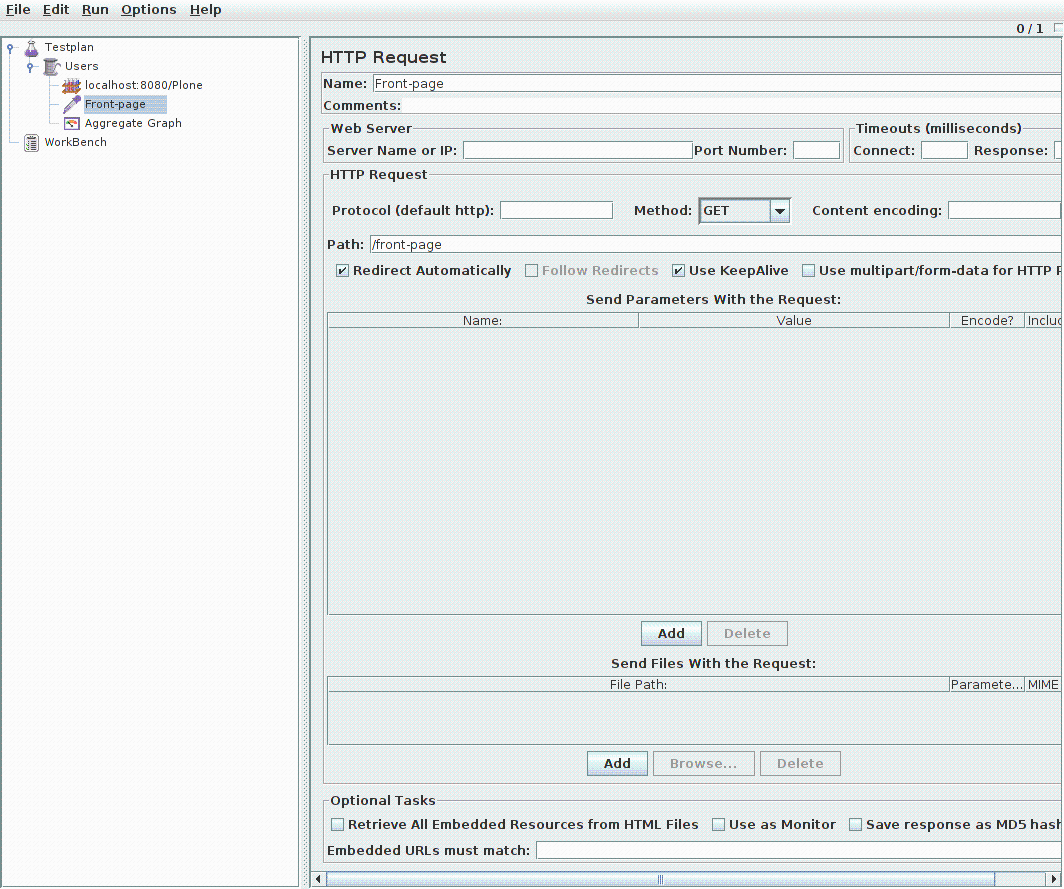
HTTP Request
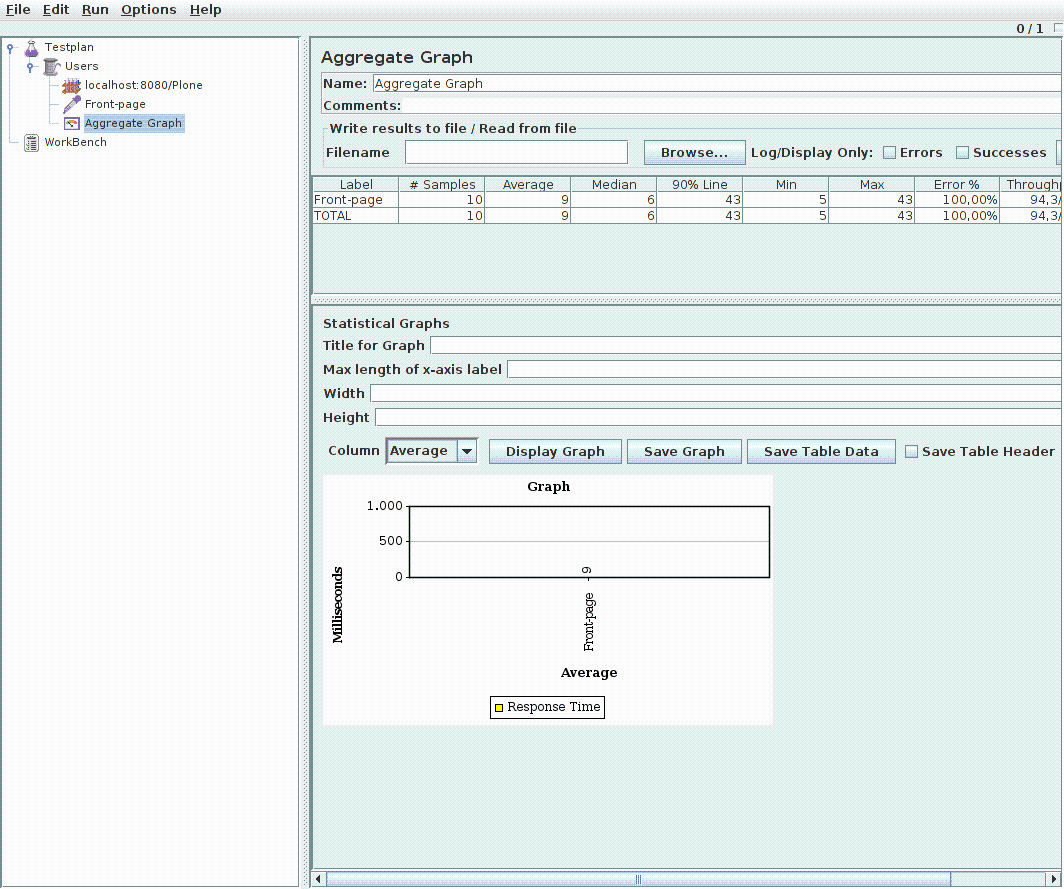
Step 6: Aggregate Graph
In order to display the results of our HTTP requests, we have to add a listener in jMeter by right-clicking on the “Testplan” in the left column of the jMeter GUI, choose “Users”, “Add”, “Listener” and “Aggregate Graph”:
Testplan > Users > Add > Listener > Aggregate Graph
Step 7: Save Test Plan
Before we can run our jMeter test plan we should save it by choosing “Save Testplan as” from the “File” menu:
File > Save Testplan as
Next Steps
Creating a test plan:
http://jmeter.apache.org/usermanual/build-web-test-plan.html
Debug requests with “View Results Tree”:
Testplan > Users > Add > Listener > View Results Tree (optional)